The View Page
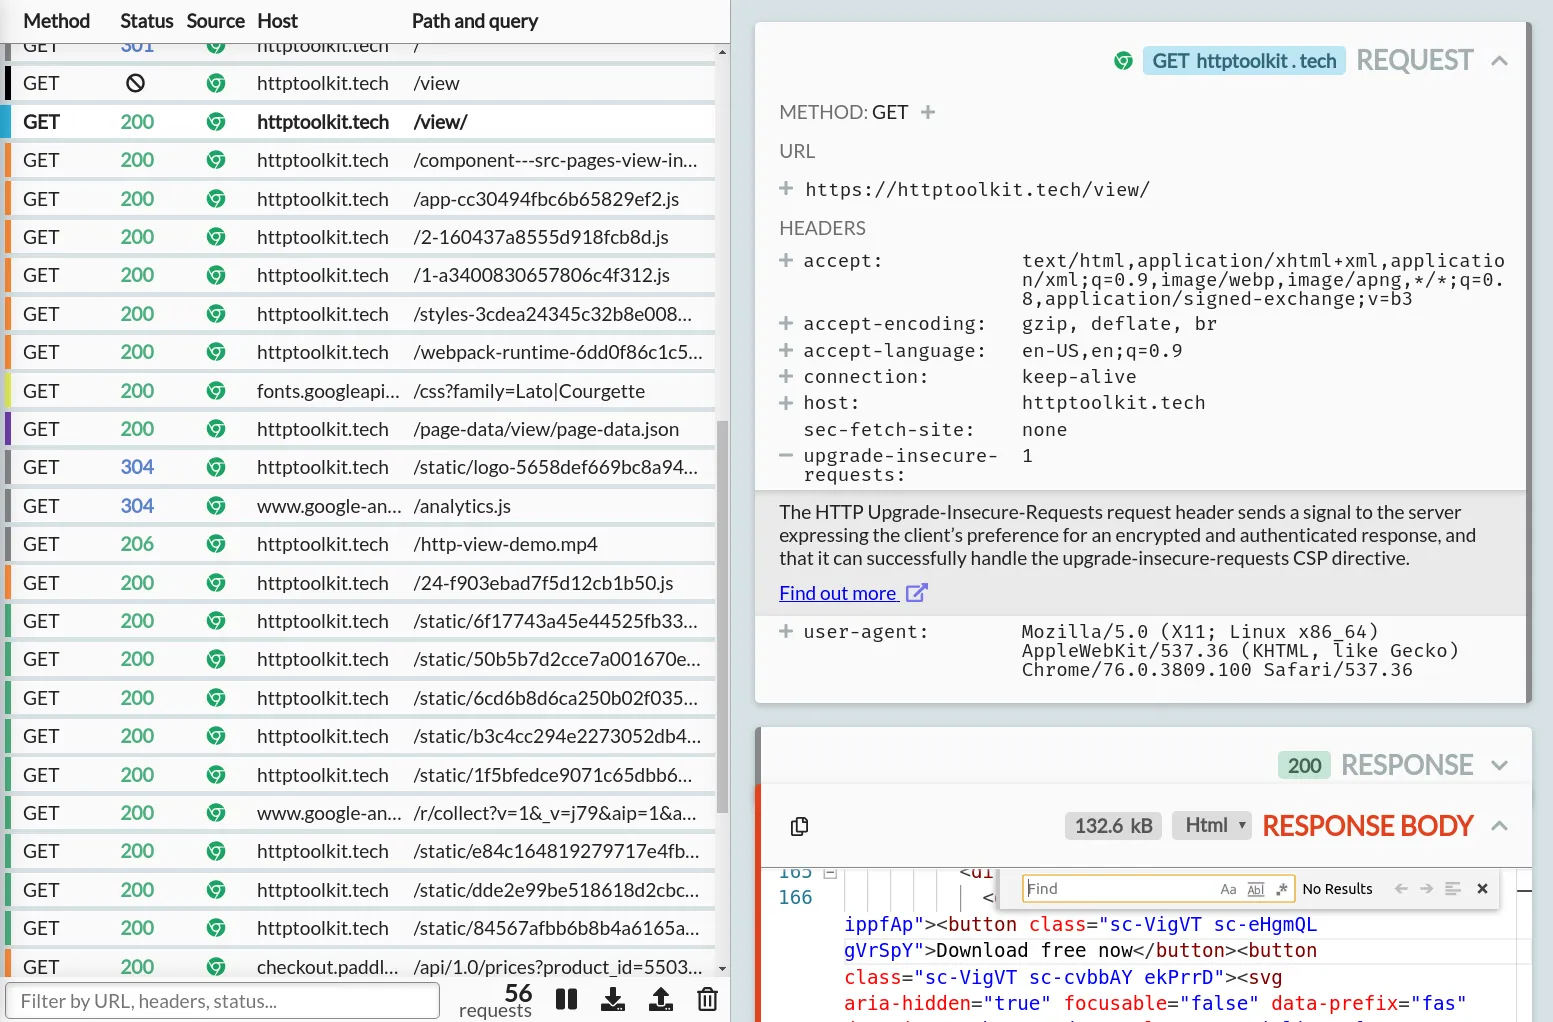
On the View page you can examine collected HTTP and HTTPS traffic up close.
It shows the traffic collected from HTTP clients that you've intercepted, and/or past HTTP traffic that you import from a HAR file, along with any non-HTTP connections that were intercepted too.
The page is in two parts:
- On the left, a list of events, with some controls to explore those.
- On the right, a pane that shows the details of the selected event, if any.
You can drag the central divider to resize either half as you'd like.
The exchange list
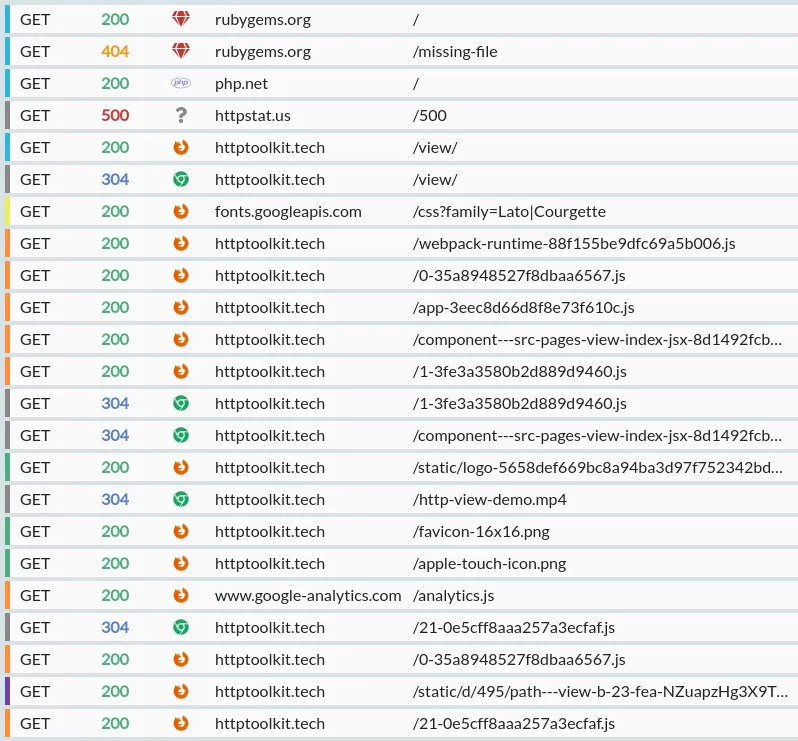
The exchange list shows a list of the HTTP events, in the order they happened. For HTTP exchanges, that's the order the requests were initially sent.
There's a few possible types of event:
- An HTTP exchange. This consists of a request, which might still be in progresss, might be at a breakpoint, might have completed with a response, or might have failed permanently.
- A failed TLS connection. This is an HTTPS request that has failed to setup the initial connection, perhaps due to the HTTP Toolkit certificate being rejected, or a connection being cancelled.
- A TLS tunnel. This is an HTTPS connection that has been passed straight through without inspection, because the host is configured for TLS passthrough on the Settings page.
- A non-HTTP connection. Not everything that arrives at the proxy is HTTP: connections using some other protocol are shown as their own rows, and you can still examine the raw data that was sent.
- A WebRTC connection, data channel, or media stream. Channels & streams exist within connections, but are shown as separate rows so that you can independently view the connection information, the data in a channel, or the transfer statistics from a stream.
- An IPFS & Ethereum interaction. This shows the core interaction details in the row itself, and then shows a detailed explanation of the IPFS/Ethereum interaction when selected (in a card at the top) and the raw HTTP data corresponding to this below.
HTTP Exchanges
Each HTTP exchange row shows:
-
A colour marker, giving an at-a-glance summary of each request:
- Black: Incomplete/failed
- Red: Mutative (e.g. POST/DELETE)
- Green: Image
- Orange: JavaScript
- Yellow: CSS
- Light blue: HTML
- Dark blue: Fonts
- Purple: Data (XML, protobuf, form data or JSON)
- Grey: Unknown
(Don't worry, you don't need to memorize these! All details of each exchange are available separately, these just help with quickly skimming the list)
-
The HTTP method used, with different colours for each verb.
-
Either:
- The response status code, also colourized.
- 🚫 if the response did not complete.
- ⚠ if the exchange is currently paused at a breakpoint.
- A spinner, if the response is still in progress.
-
The source of the request, as an icon (e.g. Firefox, Chrome, or a specific language) when it's known. You can hover over this icon for more details.
-
The URL of the request, separated into the host and the path & query. Long URLs may be truncated here, but the full URL is available as a tooltip if you mouseover the row, or in the details pane if you select the row.
To see more details on any row, click it to select it, and it'll be shown in the details pane on the right. More details on that below.
The list controls

At the bottom of the list, there's a few useful controls:
- A search bar. This filters the visible events. You can focus it at any time with Ctrl+F (or Cmd+F on Mac).
- You can type text here and it'll be matched directly against the text of every part of every exchange, except the body itself (for performance reasons).
- You can also enter a structured filter, e.g.
status=200orbody*=contentto precisely match content - See the 'Filtering intercepted traffic' section below for more information on the filtering tools available.
- The number of events shown, if your current filter is hiding any events.
- The total number of events in the list.
- A button to pause/resume interception.
- When interception is paused, traffic will continue to pass through the proxy as normal, but will not be collected or shown.
- When interception is resumed, traffic is once again collected.
- A button to export the currently visible exchanges as a HAR fileopens in a new tab, usable with many other tools (requires HTTP Toolkit Pro).
- A button to import a HAR file. These imported exchanges are appended to the list of events, and won't remove any events already present (requires HTTP Toolkit Pro).
- A button to clear the event list, deleting all events from memory.
- A button to scroll to the bottom of the list.
Filtering intercepted traffic
The search bar on the View page allows you to filter the requests that are shown. It can be used for both free-text searching (which will search all content & metadata of requests and responses except message bodies, for performance) or structured filtering, using filters to precisely match intercepted traffic.
Once you know how to use structured filters, they can be significantly more powerful, and they can be combined together to rapidly find the traffic you're interested in. Here's a quick demo video:
Some examples of structured filters are:
status!=200- Find all responses where the status is not 200bodySize>=1000- Find all response where the body is larger than 1KBhostname$=google.com- Find all requests to hostnames that end withgoogle.comheader[Authorization]^=Bearer- Find all requests with an authorization header starting withBearerbody*=error- Find all exchanges where the request or response body containserror
When entering text, if it matches one or more structured filters like this, an autosuggest for the filters you can create will appear, including suggestions for filter values taken from the traffic intercepted so far. Select a suggestion with up/down and press enter to create it. Once a structured filter is created, it will appear as a floating tag in the search bar.
As you enter text into the search bar, the event list will be updated live to match your filters as you create them, filtering against the currently highlighted filter suggestion (if there is one) or using free-text filtering if not.
These full list of structured filters is:
method- Matches requests with a given methodhostname- Matches requests sent to a given hostnamepath- Matches requests sent to a given pathquery- Matches requests with a given query stringstatus- Matches responses with a given status codeheaders- Matches exchanges by all header valuesheader- Matches exchanges by a specific header, either:header[x]to match all exchanges including anxheaderheader[x]=yto match all exchanges with anxheader whose value isy(x: y)
body- Matches exchanges by body contentbodySize- Matches exchanges by body sizecontains(x)- Matches traffic that contain a given value anywhere (in method, URL, headers, request or response bodies, WebSocket messages, etc)- Be aware that searching all content like this can be slow when large amounts of traffic have been collected, particularly if the traffic includes any large message bodies
completed- Matches requests that have received a responsepending- Matches requests that are still waiting for a responseaborted- Matches requests whose connection failed before receiving a responseerrored- Matches requests that weren't transmitted successfullypinned- Matches exchanges that are pinnedcategory- Matches exchanges by their general category (e.g.image,js,data,mutative)port- Matches requests sent to a given portprotocol- Matches exchanges by protocol, for example HTTP, HTTPS, WS or WSShttpVersion- Matches exchanges using a given version of HTTPwebsocket- Matches websocket streamsnot(x)- Matches exchanges that do not match a given conditionor(a, b)- Matches exchanges that match any one of multiple conditions
Most of these filters support a few different operators to match against values. To see the available operators for a filter, start entering the filter, and then look at the operator suggestions that appear. The operators may include:
=Exactly matches a given value!=Does not match a given value^=Value starts with a given string$=Value ends with a given string*=Value contains a given string>Value is greater than a given number>=Value is greater than or equal to a given number<Value is less than a given number<=Value is less than or equal to a given number
To explore all available filters in the app, you can also press up/down with no text entered, which will trigger the autosuggest and show you the full list of filters available.
As you explore the filter suggestions, the selected suggestion will show an autogenerated explanation of what the filter does. For example, initially selecting the body filter will show "Match exchanges by body content", entering body^= will show "Match exchanges starting with a given value", and body*=abc will show "Match exchanges starting with 'abc'". These descriptions allow you to quickly understand the filtering options as you type.
With HTTP Toolkit Pro it's also possible to save sets of filters with their own custom name, so you can quickly recreate common filters. To do so, create your filters, then type a string that doesn't match an existing filter, and select the 'Save filters' suggestion that's shown.
Once a custom filter is created, you can create it like any other, by typing the name and pressing enter to select the suggestion. To delete a custom filter, type its name so the suggestion appears, and then click the trash icon shown alongside.
Selecting events
Clicking a row selects it. You can also select many events at once, to act on them together:
- Ctrl/Cmd + click adds or removes a single row from the selection.
- Shift + click selects every row between the last selected row and the clicked row.
- Ctrl/Cmd + A selects everything currently shown.
- The arrow keys, Page Up/Down, and Home/End move the selection, and holding shift extends it instead.
- Escape clears the selection.
When more than one event is selected, the details pane on the right is replaced by a summary of the selection, showing a preview of the most recent events selected and the total count, along with buttons to:
- Toggle pinning for all of them.
- Delete all of them.
- Create one matching modify rule per selected request (requires HTTP Toolkit Pro).
- Export them all as a single HAR file (requires HTTP Toolkit Pro).
- Export them as a code snippet ZIP (requires HTTP Toolkit Pro).
The ZIP export lets you pick any number of the available code snippet formats, so each request is written out as ready-to-run code in every format you choose, with a manifest listing the contents. You can optionally include the complete raw data as a HAR file alongside, although that can make the export much larger.
The context menu
Right-clicking any event opens a context menu, which is often the quickest way to act on traffic. For an HTTP exchange this includes pinning, copying the request URL, deleting the event, and a 'Filter traffic like this' submenu to instantly show only (or hide) the hostname of that request.
With HTTP Toolkit Pro it also offers resending the request, creating a matching modify rule, exporting the exchange as HAR, and copying the request as a code snippet in any supported format. The format you pick is remembered, and then appears as a top-level 'Copy as ... Snippet' option for next time.
Right-clicking within a multiple selection shows the equivalent options for the whole selection instead.
The event details pane
The right pane is made up of a series of 'cards': collapsible sections, which provide different views of the details of the selected event. You can see an example of each card below.
For an HTTP exchange, there's a few cards that will be shown:
- A summary of the API request, for requests to recognized endpoints of public APIs like AWS, GitHub, Stripe and 2600+ others (with HTTP Toolkit Pro).
- A transform summary, if the exchange was modified by one of your rules.
- The request non-body content (method, URL & headers).
- The request body (if there is one).
- The request trailers (if there are any).
- If a response has been received:
- The response details.
- The response body (if there is one).
- The response trailers (if there are any).
- The performance details (requires HTTP Toolkit Pro).
- The export options (requires HTTP Toolkit Pro).
- Breakpoint cards, for breakpointed requests and responses.
- IPFS or Ethereum interaction details, for IPFS/Ethereum interactions.
- WebRTC connection, channel & media cards.
It's also possible to expand the request and response body cards, so they fill the entire pane. In this case, only that card will be shown.
Lastly, there's a footer shown at the button, offering quick access to various actions related to the selected event.
The API Card
Only available with HTTP Toolkit Pro
For Pro users, only for requests to recognized API endpoints, an API card will be shown summarizing the essential details of each part o fthe API request, linking to the official docs, and validating the request itself. This is powered by the OpenAPI specifications of the OpenAPI Directoryopens in a new tab. As an example:
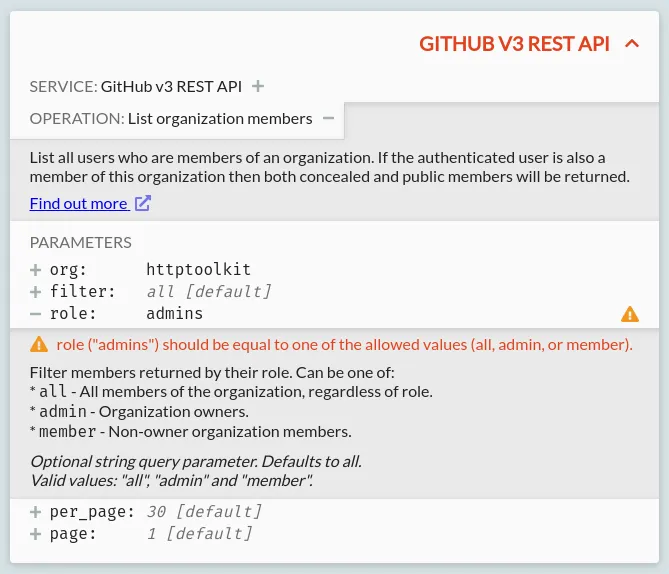
Here, a request to the GitHub API is recognized as such, so includes:
- The service the request is going to, with links to its docs
- The name of the operation itself
- A list of the parameters being specified, each including:
- The name & value of the parameter
- Documentation for the specific parameter, with a description and the valid possible values
- Validation & warnings, for invalid or missing values, and deprecated parameters or operations
The Request Card
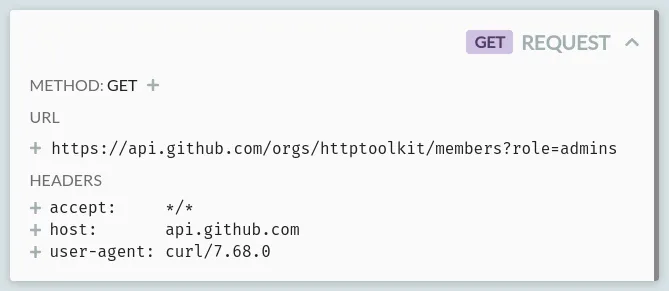
This card will always appear, and shows all the core request data: the HTTP method, URL & headers sent.
All standard methods and headers will be recognized, and clicking the plus symbol next to them will show a quick explanation of what they mean, with links to the Mozilla Developer Network's full documentation for that method or header.
The URL can also be expanded, to show it broken down for readability into the protocol, host, path, and each of the query string parameters included.
Body Cards
Both requests and responses can have bodies, and when present, the corresponding request or response body card will be shown. These both work exactly the same, and both can appear at the same time, e.g. for a POST request with a 200 response.
This card consists of a viewer for the body content, plus a few controls. Let's start with the controls:
- An expand/shrink button: this expands the body content to fill the entire right pane or shrinks it again, back to normal, if it is currently expanded.
- A save button: this saves the shown decoded body content to a file, so it can be edited or opened directly with other tools (requires HTTP Toolkit Pro)
- The number of bytes: this shows the numbers of bytes in the content itself. This is the content after decoding bodies, which may have been gzipped for example, but ignoring any content autoformatting in the editor shown.
- A dropdown to select the formatting for the body viewer. This is filtered to provide only meaningful options for each content type. There's a few options:
- Image - an image, shown as an actual image.
- Hex - the raw bytes of the body, in formatted hexadecimal.
- Text - the content of the body when decoded as UTF8 text.
- XML - the content of the body decoded as UTF8 text, autoformatted as XML, with syntax highlighting.
- JSON - the content of the body decoded as UTF8 text, autoformatted as JSON, with syntax highlighting.
- JavaScript - the content of the body decoded as UTF8 text, autoformatted as JavaScript, with syntax highlighting and intellisense.
- HTML - the content of the body decoded as UTF8 text, autoformatted as HTML, with syntax highlighting.
- CSS - the content of the body decoded as UTF8 text, autoformatted as CSS, with syntax highlighting.
- Markdown - the content of the body decoded as UTF8 text, with markdown syntax highlighting.
- YAML - the content of the body decoded as UTF8 text, with YAML syntax highlighting.
- JSON records - a stream of separate JSON values, such as newline-delimited JSON, formatted as a readable list.
- URL encoded - form data, decoded into its separate fields.
- Protobuf - protobuf data, decoded and shown as readable structured content, even without a schema.
- gRPC - the protobuf messages within a gRPC request or response, unwrapped from their gRPC framing and decoded as above.
The viewer itself appears below, showing the content formatted according to the formatting dropdown.
For images, a summary of any EXIF metadata in the image is shown above it, which can be expanded to see the full details, including the camera used and any location data embedded in the file.
The viewer is powered by a read-only Monaco editoropens in a new tab (the internals of Visual Studio Code), and includes many of the features of Visual Studio Code. For example:
- Syntax highlighting, with errors for invalid syntax.
- Type inference & intellisense, for JavaScript.
- Collapsible blocks (use the +/- in the left margin).
- Plain text and regex search (press Ctrl/Cmd + F).
- Match highlighting: select and text to see all other occurrences highlighted in the text and the scrollbar.
- Inline color tags, for colors defined in CSS content.
The Response Card
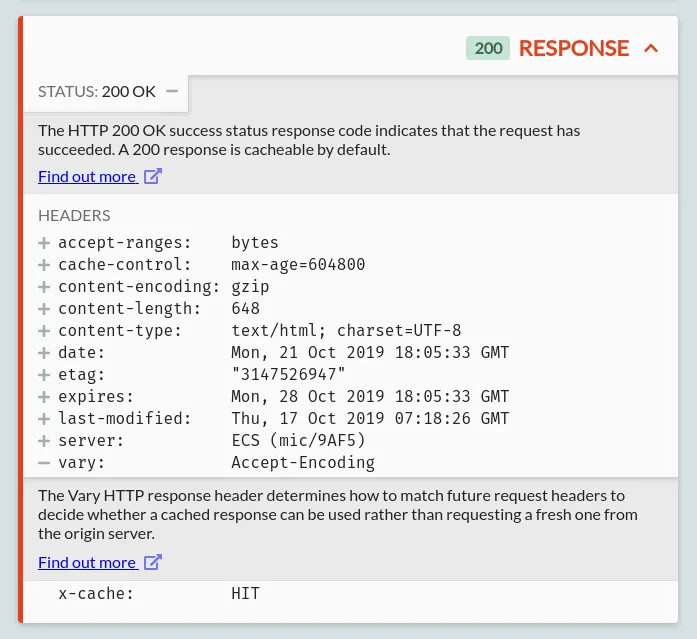
The response card shows the HTTP status code, status message, and response headers. For HTTP Toolkit Pro users, the response status itself may come with further explanations powered by any detected OpenAPI specifications from the OpenAPI Directoryopens in a new tab.
All standard status codes and headers on this card are automatically recognized, and clicking the plus symbol next to them will show a quick explanation of what they mean, and links to the Mozilla Developer Network's full documentation for that status or header.
The Transform Card
When an exchange has been modified by one of your rules, an extra card appears at the top showing which rule matched, which you can click to jump straight to that rule on the Modify page.
Because the data the client sent and the data the server received are no longer the same, this card also lets you choose which version of the exchange the cards below should show:
- Show transformed content: the data after your rules were applied.
- Show original content: the data before your rules were applied.
- Show the client's perspective: what the client sent, and what it received back.
- Show the server's perspective: what the server received, and what it sent back.
This setting applies to every exchange you look at, until you change it again.
Trailer Cards
Some HTTP responses (and, more rarely, requests) send extra headers after the body, known as trailers. When these are present, they're shown in their own card, in exactly the same format as the normal header cards.
The Performance Card
Only available with HTTP Toolkit Pro
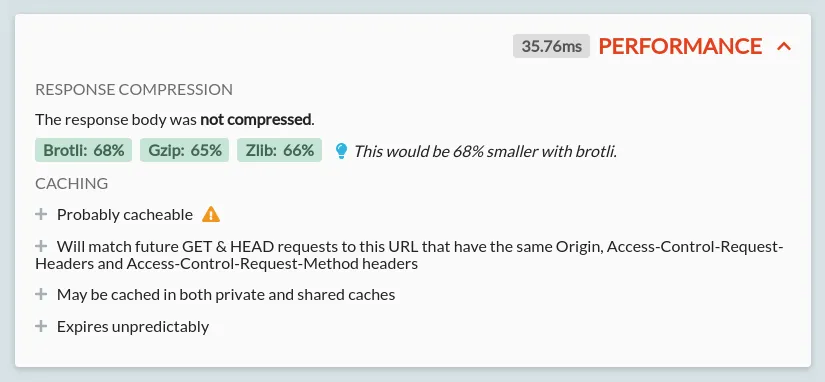
The performance card shows the performance details for the given response. These include:
- The exact time taken for the full request and response
- For both the request & response bodies:
- The compression algorithm used, and its relative (percentage reduction) & absolute (bytes saved) performance
- The potential improvements with alternative compression algorithms:
- When improvements are available, the algorithm is shown as green, and a suggestion appears alongside. This suggestion will include a note if your current HTTP client does not advertise support for the best available compression algorithm
- A warning will be shown if the current compression algorithm is increasing the size of the body
- For each algorithm, the specific compressed & uncompressed sizes can be seen by hovering over its result
- Exact results might vary slightly from those shown, depending on the settings used, but they should be representative
- The caching behaviour of the given request with explanations:
- This is separated into a few sections:
- Whether the response is cacheable at all
- Which future requests can reuse this response from the cache
- Which types of cache are allowed to store the response
- When the response will expire, and how and when it should be revalidated
- Each section can be expanded to see an explanation of the given behaviour
- Sections with potential improvements or issues will be shown with a lightbulb or warning icon, respectively
- The explanations here indicate the behaviour allowed by the caching standards. Individual cache behaviour will depend on these, but can vary further. For example, caches are not obliged to cache cacheable content, but should never cache non-cacheable content.
- This is separated into a few sections:
The Export Card
Only available with HTTP Toolkit Pro
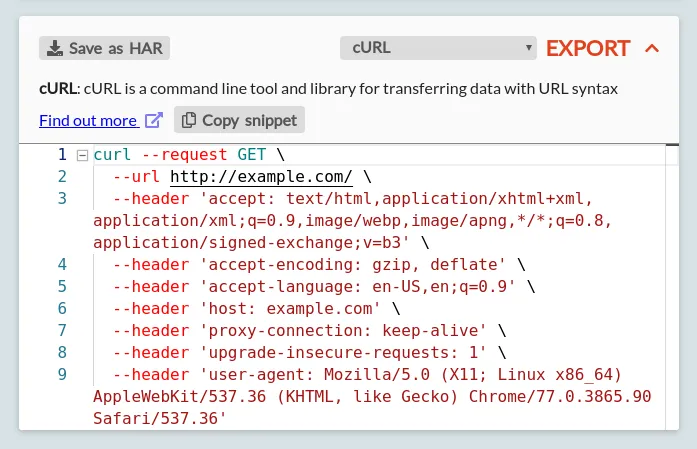
The export card allows you to export a given request & response as a HAR file, or to export the request as ready-to-use code for a wide selection of languages.
You can export the exchange as a HAR file by clicking the 'Save as HAR' button in the top left. This exports this individual exchange into a standalone file. Note that's it's also possible to export the full set of currently filtered exchange from the exchange list on the left, using the export button in the list footer.
To export as a code snippet, first pick your language or tool of choice from the list. The list includes:
- C: Libcurl
- Clojure: clj-http
- C#:
- RestSharp
- HttpClient
- Go: NewRequest
- Raw HTTP/1.1
- Java:
- OkHttp
- Unirest
- AsyncHttp
- java.net.http
- JavaScript
- jQuery
- fetch
- XMLHttpRequest
- Axios
- Kotlin: OkHttp
- Node.js:
- Built-in HTTP module
- Request
- Unirest
- Axios
- Fetch
- Objective-C: NSURLSession
- OCaml: CoHTTP
- PHP:
- cURL
- HTTP v1
- HTTP v2
- Powershell:
- Invoke-WebRequest
- Invoke-RestMethod
- Python:
- http.client
- Requests
- R: httr
- Ruby: net::http
- Shell:
- cURL
- HTTPie
- Wget
- Swift:
- NSURLSession
A short description of the client and a link to its full docs will be shown in the body of the card, followed by the full code snippet (shown in a Monaco editor, with all the same features of the body editors described above).
You can copy the entire snippet using the 'Copy snippet' button, or copy individual segments of the snippet by hand.
Each snippet is intended to be representative ready-to-use code for the given target, but you should pay attention to application specific details, and be aware they you may need to customize security settings (e.g. certificate trust & validation) and add appropriate error handling for your specific environment.
Breakpoint Cards
When viewing a request or response that is paused at a breakpoint, some other cards may not appear, or may be replaced by editable cards. The rules that trigger breakpoints can be configured on the Modify page.
Breakpointed requests can be edited before they are sent upstream to their target server, or you can respond to them directly without forwarding the request. Breakpointed responses can be edited before they are returned to the initiating HTTP client.
A breakpointed request looks like this:
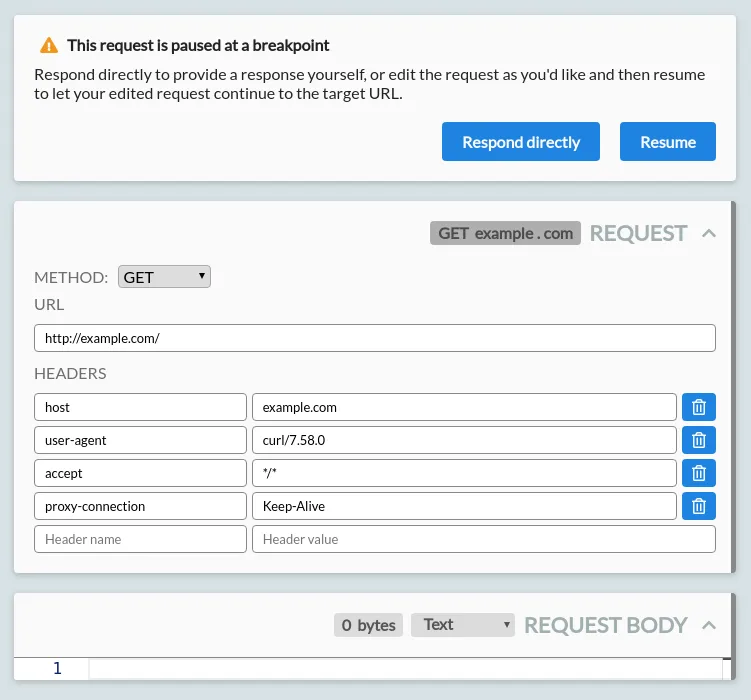
From here, you can:
- Change the request method.
- Edit the request URL:
- You can change the request protocol, path or query.
- Alternatively, edit the hostname to redirect it to a different server entirely.
- Editing the hostname will automatically update the Host header to match.
- Edit the request headers.
- Edit the empty name/value row at the bottom to add new headers.
- Click the delete button shown on any existing row to remove existing headers.
- Edit the request body.
- You can select the syntax highlighting to use with the dropdown on the right.
- If there is a content-length header set that matches the body length, editing the body will automatically update the header to match.
- The body is shown in its decoded form. If a content-encoding header is set, the body will be re-encoded before the request is forwarded.
Press 'Resume' in the breakpoint header to forward your request on to the target server.
You can also press 'Response directly' to skip forwarding the request entirely, and instead manually provide your own response. This triggers an immediate response breakpoint, for an empty response.
A breakpointed response looks like this:
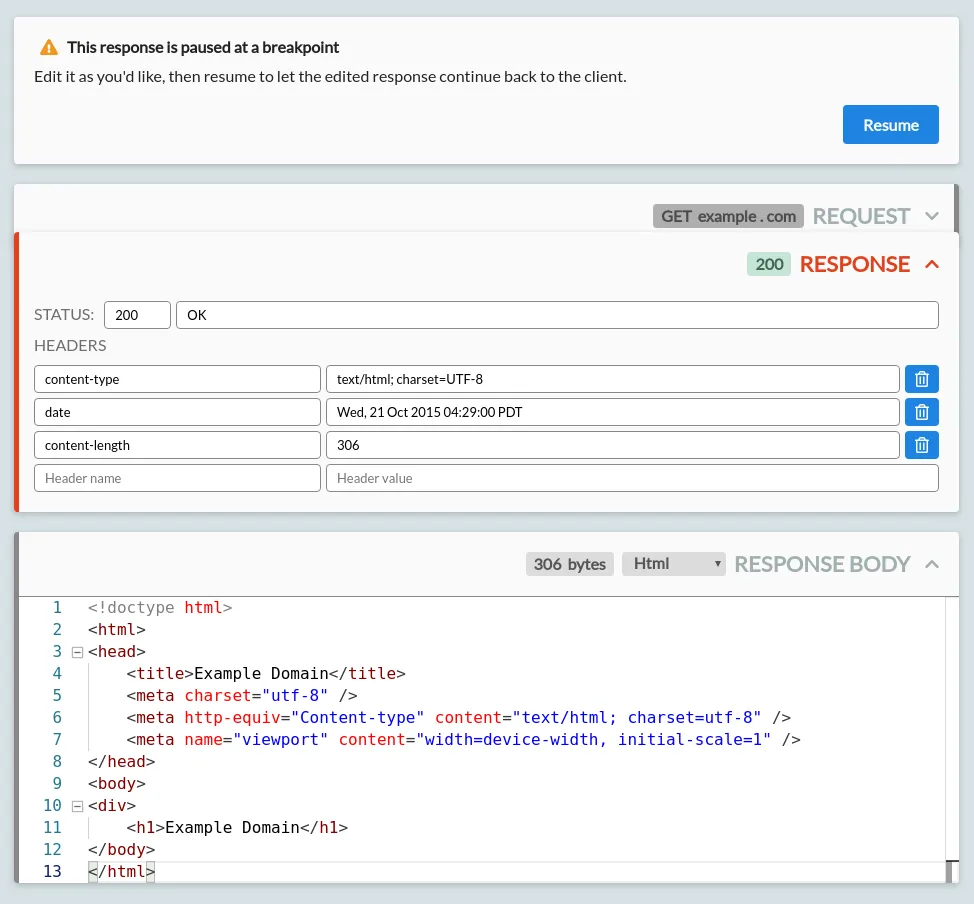
From here, you can:
- Edit the status code or status message that will be returned.
- Edit the response headers.
- Edit the empty name/value row at the bottom to add new headers.
- Click the delete button shown on any existing row to remove existing headers.
- Edit the response body.
- You can select the syntax highlighting to use with the dropdown on the right.
- If there is a content-length header set that matches the body length, editing the body will automatically update the header to match.
- The body is shown in its decoded form. If a content-encoding header is set, the body will be re-encoded before the request is forwarded.
When you're done, press resume to let the response continue back to the HTTP client.
There are a couple of other things about breakpointing worth noting:
- When hitting a response breakpoint, request data has already been received, and can be seen in the cards above the editable response.
- Whilst waiting at a breakpoint, your client is not receiving content, and may time out. If this happens, your breakpoint will close suddenly, and will appear like any other timed out or aborted request. To avoid this, increase the timeout in your client, or edit quickly!
- After your breakpointing is all done, the exchange content shown is always the data from the perspective of the client. That means:
- The edited request data will not be shown - you'll see the data that the client actually sent, not the data sent to the server.
- The original response data will not be shown - you'll see the data that the client actually received, not the data received from the server.
IPFS and Ethereum Cards
When an IPFS or Ethereum interaction is selected, an extra card will be shown above the raw HTTP data, showing the details of the interaction:
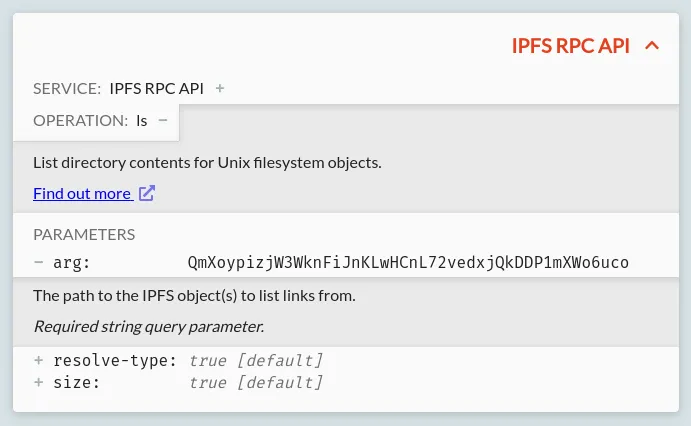
The details shown will depend on the request and the specific type of interaction, but in general this card will include:
- The service that's being connected to (in this case either IPFS or Ethereum) with some basic information available when expanded, along with links to the general documentation.
- The specific operation that's happening, with more specific details available when expanded, and a link to the official documentation for this specific type of interaction.
- The list of parameters that are sent: both explicitly sent parameters, and the default values of omitted default parameters (shown greyed out & italic). Each can be expanded to show a description, and the expected type and other metadata.
If the parameters for an Ethereum or IPFS request are invalid or unrecognized, errors may also be shown here.
WebRTC Cards
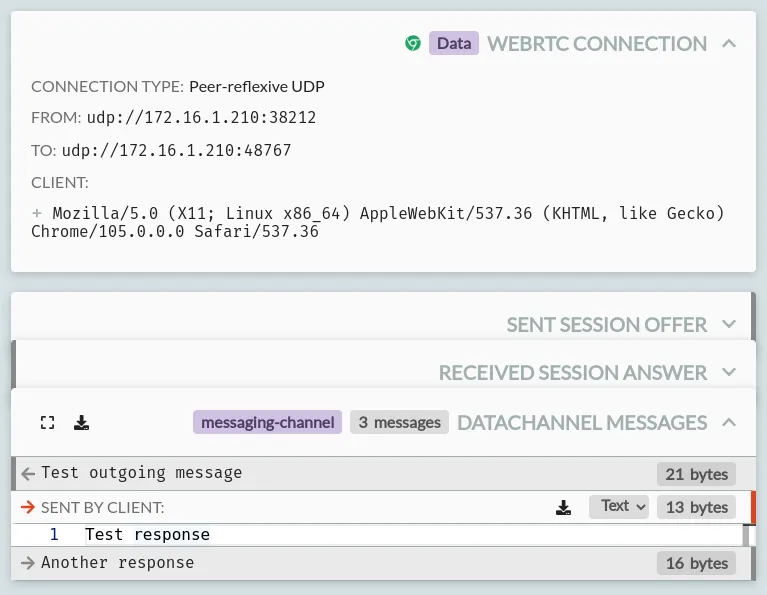
WebRTC traffic is shown in a selection of cards, including:
- A 'WebRTC Connection' card, showing:
- The type of connection
- The addresses of both ends of the connection
- The address of the web page that created this connection
- The user agent of the client that created this connection
- A send or received 'Session Offer' (depending on which end initiated the connection) including the SDP that was offered.
- A send or received 'Session Answer' (depending on which end answered the connection) including the SDP that answered the offer.
- 'Datachannel Messages' cards, showing:
- The label of the channel, in the card header.
- A list of messages, for each message on the channel, along with their size and whether they were sent as text or binary data.
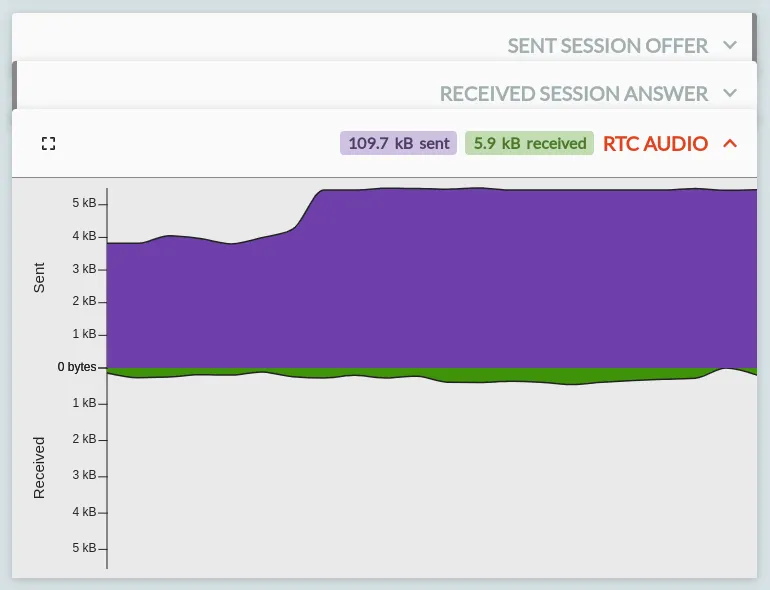
- 'RTC Video' and 'RTC Audio' cards, showing the bandwidth sent & received per-second for each media channel on the connection.
Connection Cards
Not every connection carries HTTP, and those that don't get their own simpler details panes:
- A failed TLS connection shows what was known about the client before the connection failed, which is usually enough to work out which client rejected the certificate and why.
- A TLS tunnel shows a connection that was passed through untouched, because its host is configured for TLS passthrough on the Settings page. The contents are encrypted, so only the connection details are available.
- A non-HTTP connection shows the raw data that was sent, in a 'Raw Data' card, so you can examine protocols that HTTP Toolkit doesn't parse itself.
The event details footer

Below all those cards, there is a footer. Like any button in HTTP Toolkit, you can hover over each icon here to get a description of what it does.
From left to right, the buttons shown above:
- Jump to the selected event in the left pane of the View page
- Pin the event, so that it's marked in the list and is not deleted when the list is cleared (or unpin the event, if it's already pinned).
- Delete this event, so it's removed entirely.
- Create a modify rule from this event, initially matching the given request data and simply returning the same response directly (without forwarding the request) which you can then modify to easily change the behaviour of similar future requests.
- Resend the request, creating a new request on the Send page, ready to be resent to the server directly and/or modified to test different requests.
The buttons shown depend somewhat on the type of event, and these options may not all be available in all cases.
Any questions? Get in touch
Suggest changes to this pageon GitHubopens in a new tab